


How to Leverage Excel for Finance, Analytics, and Project Management
Microsoft Excel has long been a cornerstone of business productivity. From startups and small businesses to multinational corporations, organizations rely on Excel to analyze data, build financial models, and manage projects. Its flexibility, extensive formula library, and powerful visualization tools make it an indispensable application for professionals across industries.
Whether you are a business owner, financial analyst, or project manager, mastering Excel can improve decision-making, streamline workflows, and enhance collaboration. This guide explores how Excel supports key business functions, including financial modeling, analytics, and project management.
Why Excel Remains Essential for Businesses
Despite the rise of specialized software, Excel continues to thrive because it is:
- Widely available and familiar
- Highly customizable
- Compatible with numerous data sources
- Suitable for both simple and complex analyses
- Easy to integrate with other Microsoft tools
Its versatility allows businesses to adapt spreadsheets to a wide variety of tasks and processes.
Using Excel for Financial Modeling
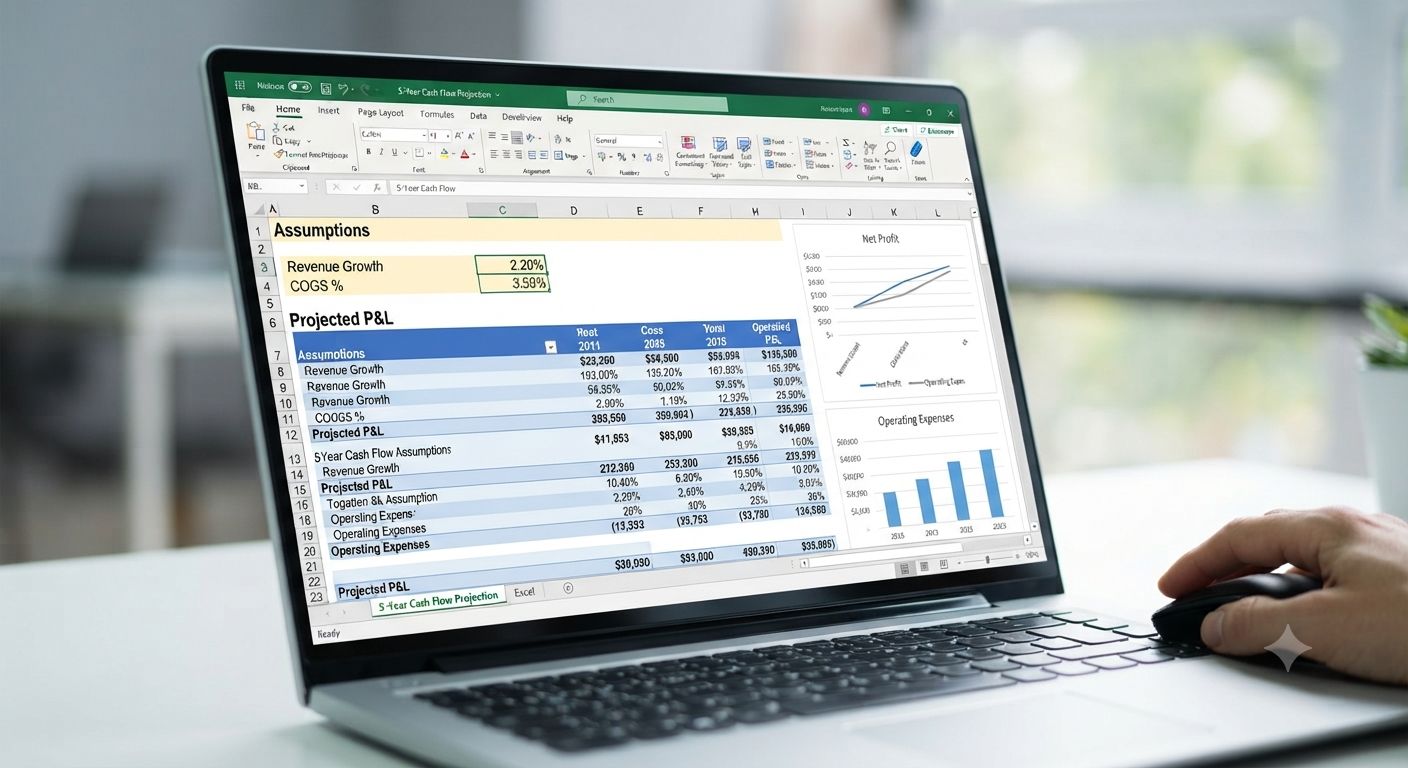
Financial models help organizations forecast performance, evaluate investments, and plan for the future.
Common types of models include:
- Budget models
- Cash flow forecasts
- Profit and loss projections
- Valuation models
- Scenario analyses
Excel’s formulas and functions enable users to build dynamic models that update automatically as assumptions change.
Key Financial Functions
Frequently used functions include:
- NPV
- IRR
- PMT
- XLOOKUP
- SUMIFS
These tools support accurate calculations and informed financial decisions.
Create Interactive Dashboards
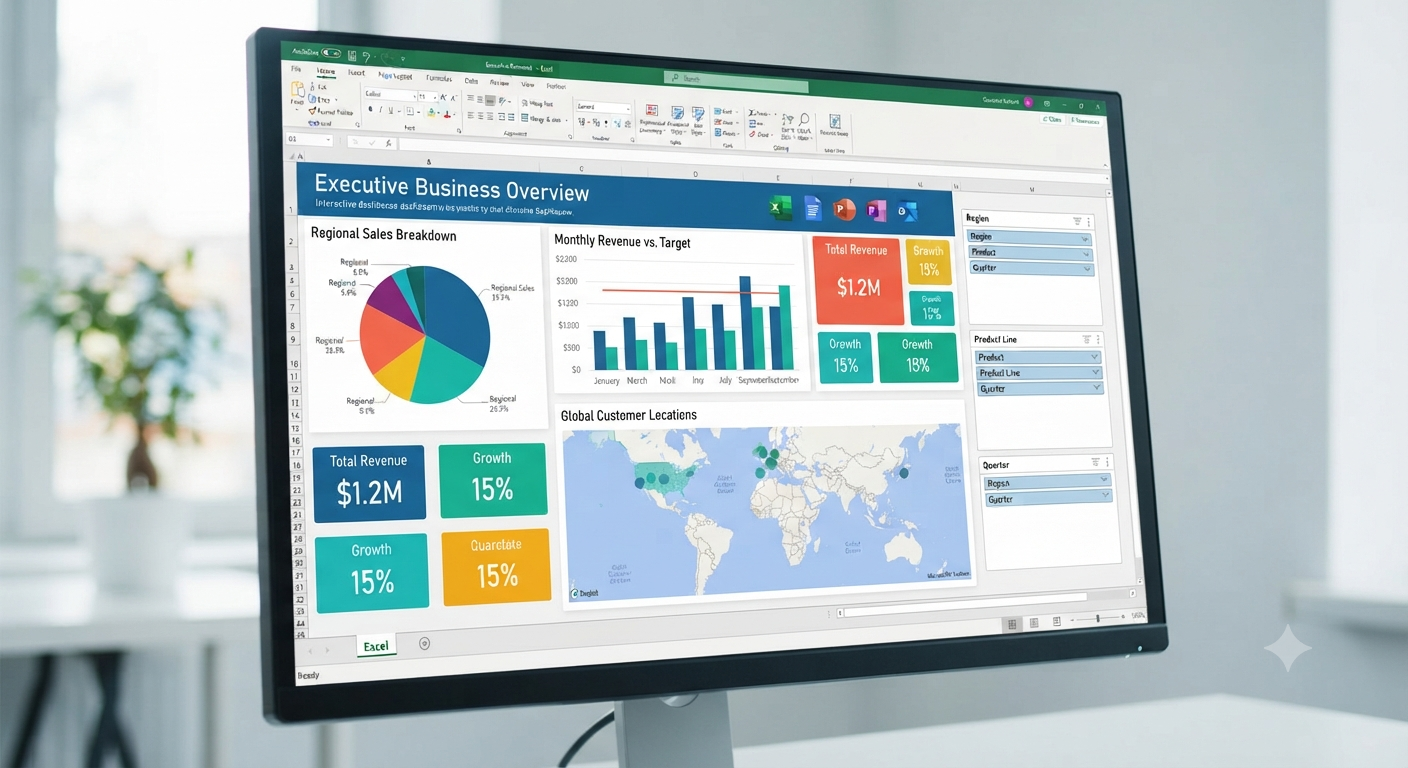
Dashboards consolidate key metrics into a single, easy-to-read view.
An effective Excel dashboard may include:
- Revenue trends
- Expense summaries
- Sales performance indicators
- Charts and conditional formatting
Interactive elements such as slicers and drop-down lists allow users to explore data from different perspectives.
Image: Excel business dashboard with charts and KPIs.
Leverage Data Analytics Features
Excel provides a variety of analytics capabilities that help businesses uncover insights.
Useful features include:
- PivotTables
- PivotCharts
- Data Analysis ToolPak
- Forecasting tools
- Power Query
These features make it possible to summarize large datasets and identify trends quickly.
Improve Data Quality
Reliable analysis depends on clean data.
Use Excel tools to:
- Remove duplicates
- Validate data entries
- Standardize formats
- Highlight inconsistencies
Maintaining high-quality data leads to more trustworthy conclusions.
Manage Projects with Excel
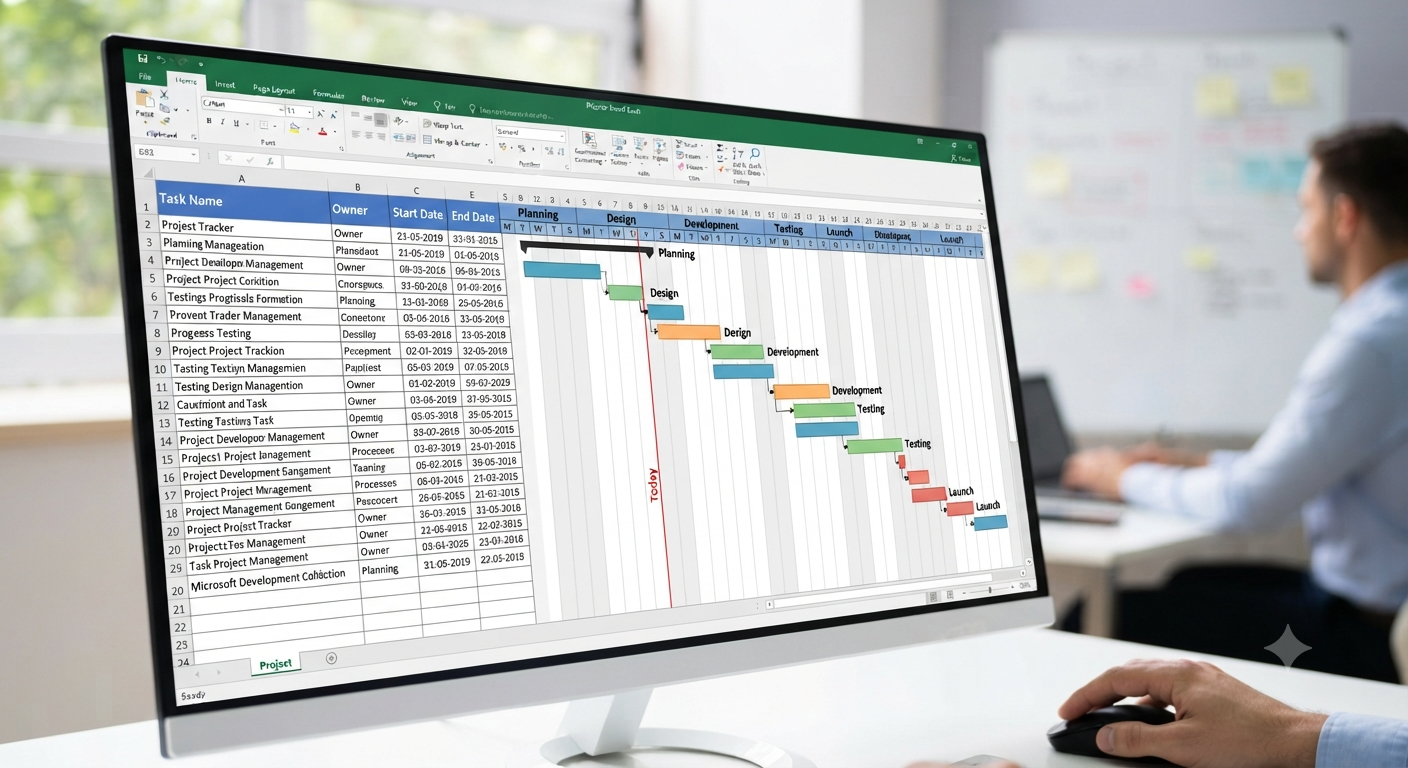
Excel is also a practical project management tool, particularly for small and medium-sized teams.
You can create:
- Task lists
- Project schedules
- Resource allocation sheets
- Budget trackers
- Gantt charts
These spreadsheets provide a clear overview of project status and deadlines.
Build a Gantt Chart
A Gantt chart visually represents project timelines.
By combining dates, conditional formatting, and bar charts, you can track progress and identify scheduling conflicts with ease.
Collaborate Using Microsoft 365
When stored in OneDrive or SharePoint, Excel workbooks support:
- Real-time co-authoring
- Comments and mentions
- Version history
These features enable teams to work together efficiently, regardless of location.
Automate Repetitive Tasks
Automation can save significant time.
Consider using:
- Macros
- VBA scripts
- Power Automate integrations
Automating routine processes reduces errors and improves productivity.
Best Practices for Business Spreadsheets
To create professional and reliable workbooks:
- Use consistent formatting.
- Separate inputs from calculations.
- Document assumptions.
- Protect important formulas.
- Back up files regularly.
Following these practices improves maintainability and reduces risk.
Common Mistakes to Avoid
Avoid:
- Overly complex formulas
- Hidden data dependencies
- Inconsistent naming conventions
- Lack of documentation
Simple, well-organized spreadsheets are easier to audit and update.
Developing Excel Skills
Business users should continually expand their Excel knowledge by exploring advanced functions, attending training courses, and practicing with real-world datasets.
Strong spreadsheet skills can enhance both productivity and career opportunities.
Frequently Asked Questions
Is Excel suitable for large-scale business analysis?
Yes. Excel can handle substantial datasets and integrate with tools such as Power BI for more advanced analytics.
Can Excel replace project management software?
For many small projects, yes. Larger or more complex initiatives may benefit from dedicated project management platforms.
Do I need programming skills to use Excel effectively?
No. Most business tasks can be accomplished with built-in features and formulas, though VBA knowledge can be helpful for automation.
What is the most important Excel feature for analysts?
PivotTables are among the most valuable tools because they enable rapid data summarization and exploration.
Conclusion
Excel remains one of the most powerful and versatile tools available to businesses. Its capabilities in financial modeling, data analytics, and project management allow organizations to make informed decisions, improve efficiency, and achieve their goals.