


How to Compute a P-Value in Excel
A p-value is a fundamental concept in statistics that helps researchers determine whether the results of a hypothesis test are statistically significant. Whether you are analyzing business data, conducting scientific research, or completing a school assignment, knowing how to calculate and interpret a p-value is an essential skill.
Microsoft Excel provides several built-in functions and tools that make statistical analysis accessible, even for users with limited experience in statistics. By using the appropriate formulas or the Data Analysis ToolPak, you can quickly calculate p-values for common tests without needing specialized statistical software.
This guide explains what a p-value is, when to use it, and how to calculate it in Excel using different methods.
What Is a P-Value?
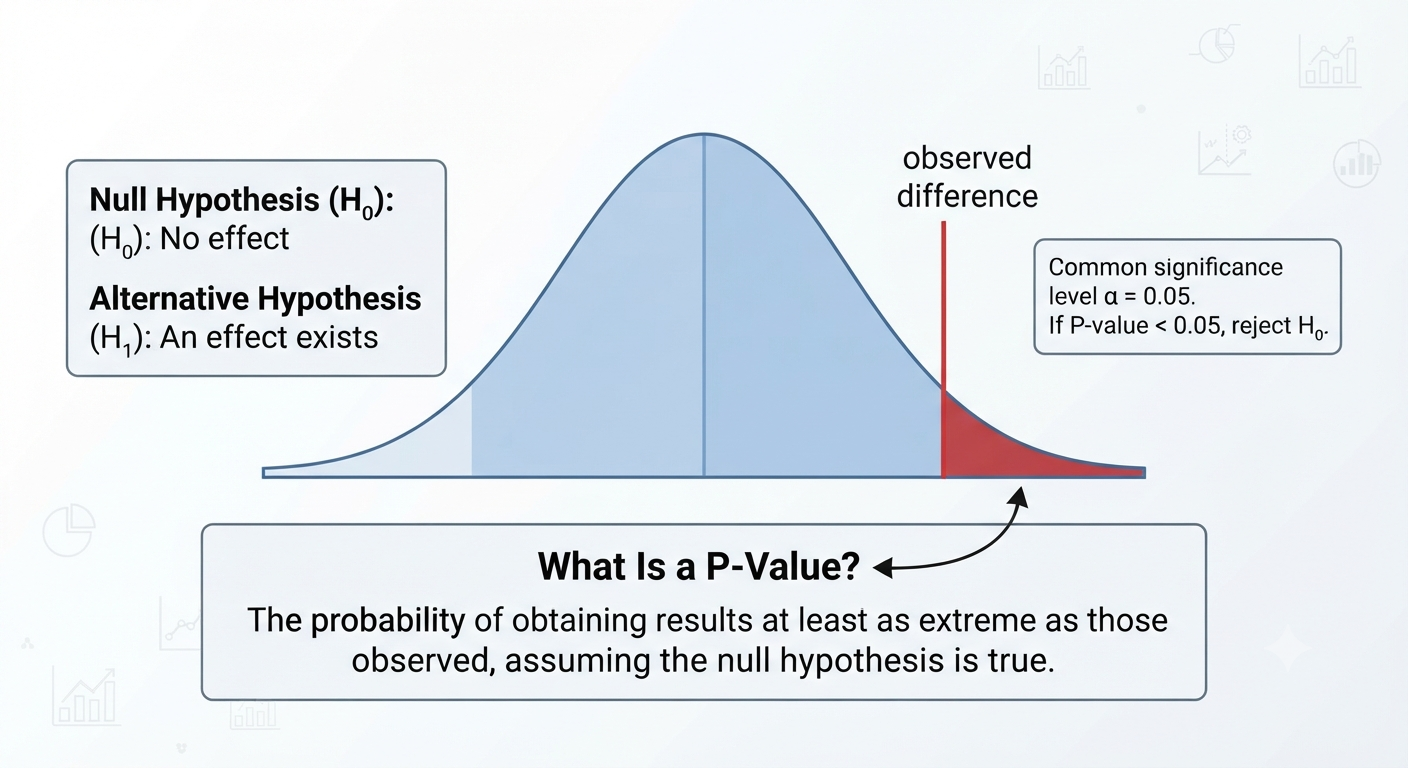
A p-value represents the probability of obtaining results at least as extreme as those observed, assuming that the null hypothesis is true.
In hypothesis testing:
- A small p-value suggests that the observed data are unlikely under the null hypothesis.
- A large p-value indicates that the data are reasonably consistent with the null hypothesis.
A common significance level is 0.05, though other thresholds may be used depending on the field of study.
Understanding the Null and Alternative Hypotheses
Before calculating a p-value, define your hypotheses:
- Null hypothesis (H₀): Assumes no effect or no difference.
- Alternative hypothesis (H₁): Assumes an effect or difference exists.
The p-value helps you decide whether there is enough evidence to reject the null hypothesis.
Prepare Your Data in Excel
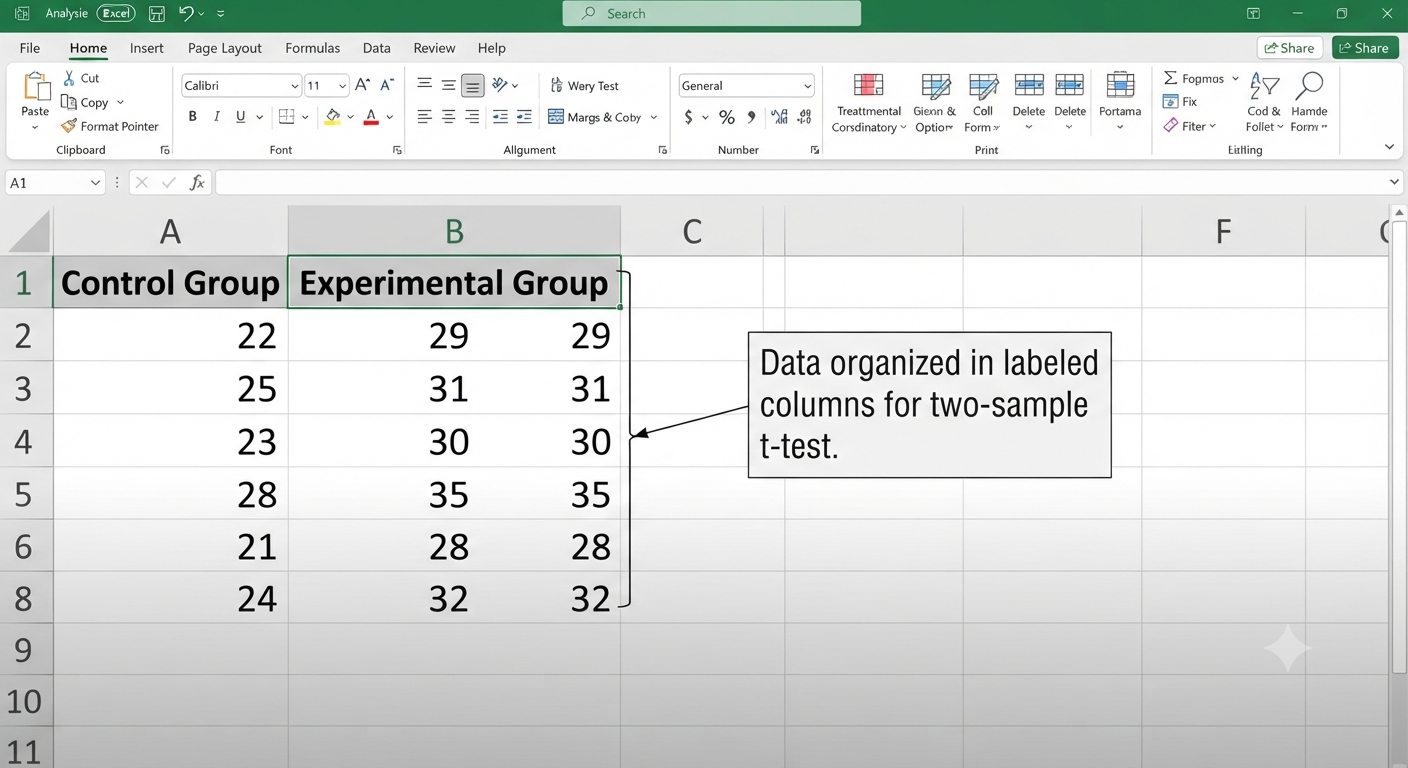
Organize your data clearly in columns with appropriate labels. For example, place observations from two groups in separate columns if you plan to perform a t-test.
Clean, well-structured data reduces the chance of calculation errors and simplifies analysis.
Enable the Data Analysis ToolPak
Many statistical procedures in Excel require the Analysis ToolPak.
To enable it:
- Select File > Options.
- Click Add-ins.
- Choose Excel Add-ins and select Go.
- Check Analysis ToolPak.
- Click OK.
Once enabled, the Data Analysis button appears on the Data tab.
Calculate a P-Value Using a t-Test
A t-test is commonly used to compare the means of two groups.
Using the Data Analysis Tool
- Open the Data tab.
- Click Data Analysis.
- Choose the appropriate t-test.
- Select the input ranges.
- Specify an output location.
- Run the analysis.
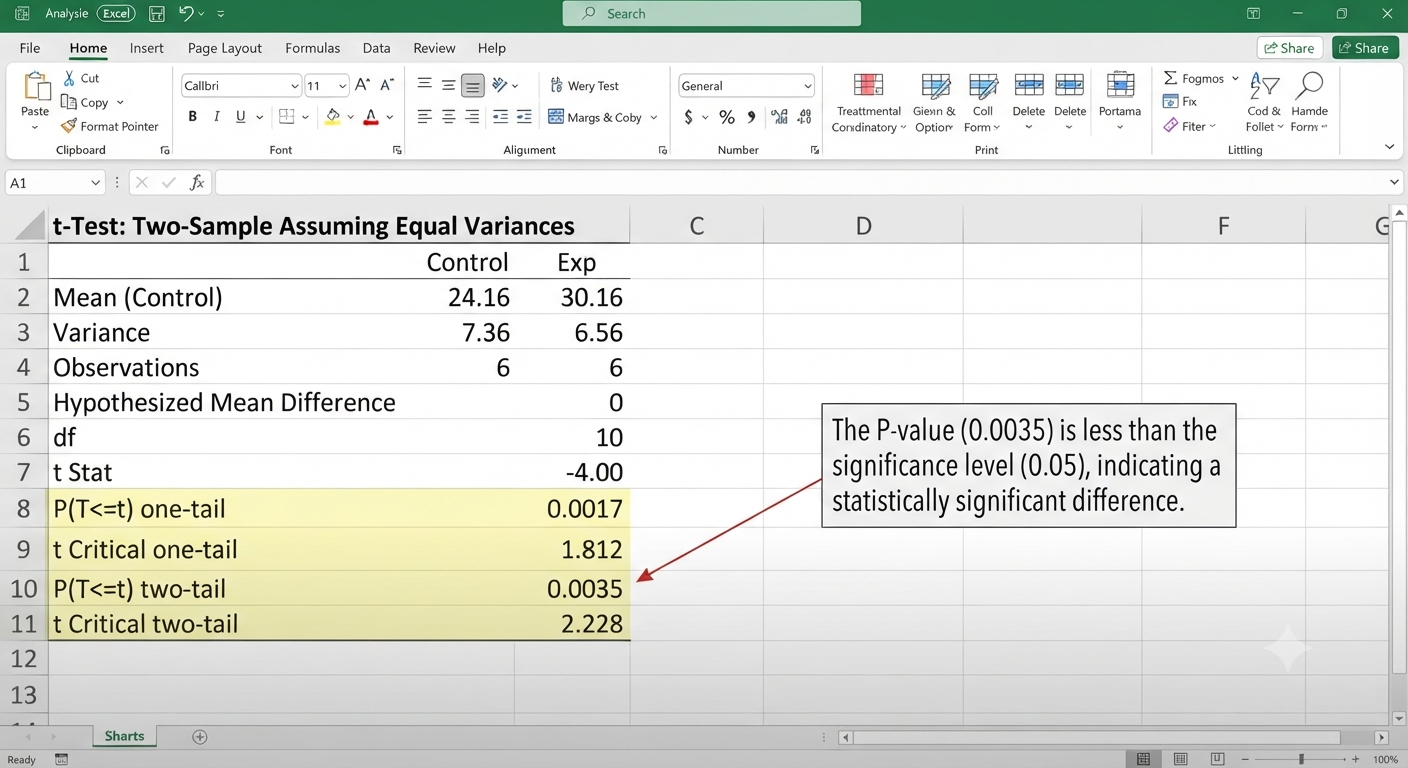
The output table includes the p-value, often labeled as P(T<=t).
Image: Excel t-test output.
Calculate a P-Value with Functions
Excel also provides worksheet functions for probability calculations.
For example, to find a two-tailed p-value from a z-score:
=2*(1-NORM.S.DIST(ABS(z),TRUE))Replace z with your calculated z-statistic.
This approach is useful when you already know the test statistic.
Use the T.TEST Function
The T.TEST function returns the probability associated with a t-test.
Its syntax is:
=T.TEST(array1,array2,tails,type)Where:
- array1 and array2 are the data ranges.
- tails specifies a one-tailed or two-tailed test.
- type specifies the t-test variant.
This function directly returns the p-value.
Interpret the Results
After obtaining the p-value:
- If the p-value is less than your significance level, reject the null hypothesis.
- If the p-value is greater, do not reject the null hypothesis.
Remember that statistical significance does not necessarily imply practical importance.
Common Mistakes to Avoid
When working with p-values in Excel:
- Do not confuse statistical significance with causation.
- Ensure you select the correct test.
- Verify that your data meet the assumptions of the test.
- Use the appropriate number of tails.
- Double-check data ranges before running analyses.
Careful preparation leads to more reliable conclusions.
Tips for Accurate Statistical Analysis
To improve your results:
- Label your data clearly.
- Inspect for outliers.
- Use charts to visualize distributions.
- Document your assumptions.
- Save a copy of the original dataset.
These habits make your analyses easier to understand and reproduce.
Frequently Asked Questions
Can Excel calculate p-values automatically?
Yes. Excel can calculate p-values using built-in functions such as T.TEST and through the Data Analysis ToolPak.
What significance level should I use?
A significance level of 0.05 is common, but the appropriate threshold depends on your field and research goals.
Is a smaller p-value always better?
Not necessarily. A small p-value indicates stronger evidence against the null hypothesis, but practical significance and study design must also be considered.
Do I need the Analysis ToolPak?
No. Some p-values can be calculated with worksheet functions alone, although the ToolPak simplifies many common tests.
Conclusion
Excel provides a convenient and accessible way to calculate p-values for a variety of statistical tests. By understanding the underlying concepts, organizing your data properly, and using the appropriate functions or analysis tools, you can perform meaningful hypothesis tests directly within your spreadsheet.