


Mastering Excel: Essential Features Every Professional Should Know
Microsoft Excel has established itself as one of the most powerful and versatile productivity tools in the modern workplace. From financial analysts and accountants to project managers, engineers, marketers, and researchers, professionals across nearly every industry rely on Excel to organize data, perform calculations, automate repetitive tasks, and create insightful reports. While many users are familiar with basic spreadsheets and formulas, mastering Excel’s advanced features can dramatically improve efficiency, accuracy, and decision-making.
This comprehensive guide explores the essential features and functionalities every professional should know to maximize productivity with Microsoft Excel.
Why Excel Is Essential for Professionals
Excel is more than just a spreadsheet application. It serves as a complete data management and analysis platform capable of handling everything from simple lists to complex financial models and business intelligence dashboards.
Some reasons why professionals continue to rely on Excel include:
- Easy data organization
- Powerful calculation capabilities
- Advanced reporting tools
- Wide compatibility with business software
- Extensive automation options
- Integration with Microsoft 365 services
Its flexibility allows users to adapt spreadsheets for virtually any business process.
Understanding the Excel Interface
Before exploring advanced features, it is important to become familiar with the Excel workspace.
The primary components include:
- Ribbon
- Quick Access Toolbar
- Formula Bar
- Name Box
- Worksheet Tabs
- Rows and Columns
- Status Bar
Learning these interface elements helps users navigate workbooks more efficiently.
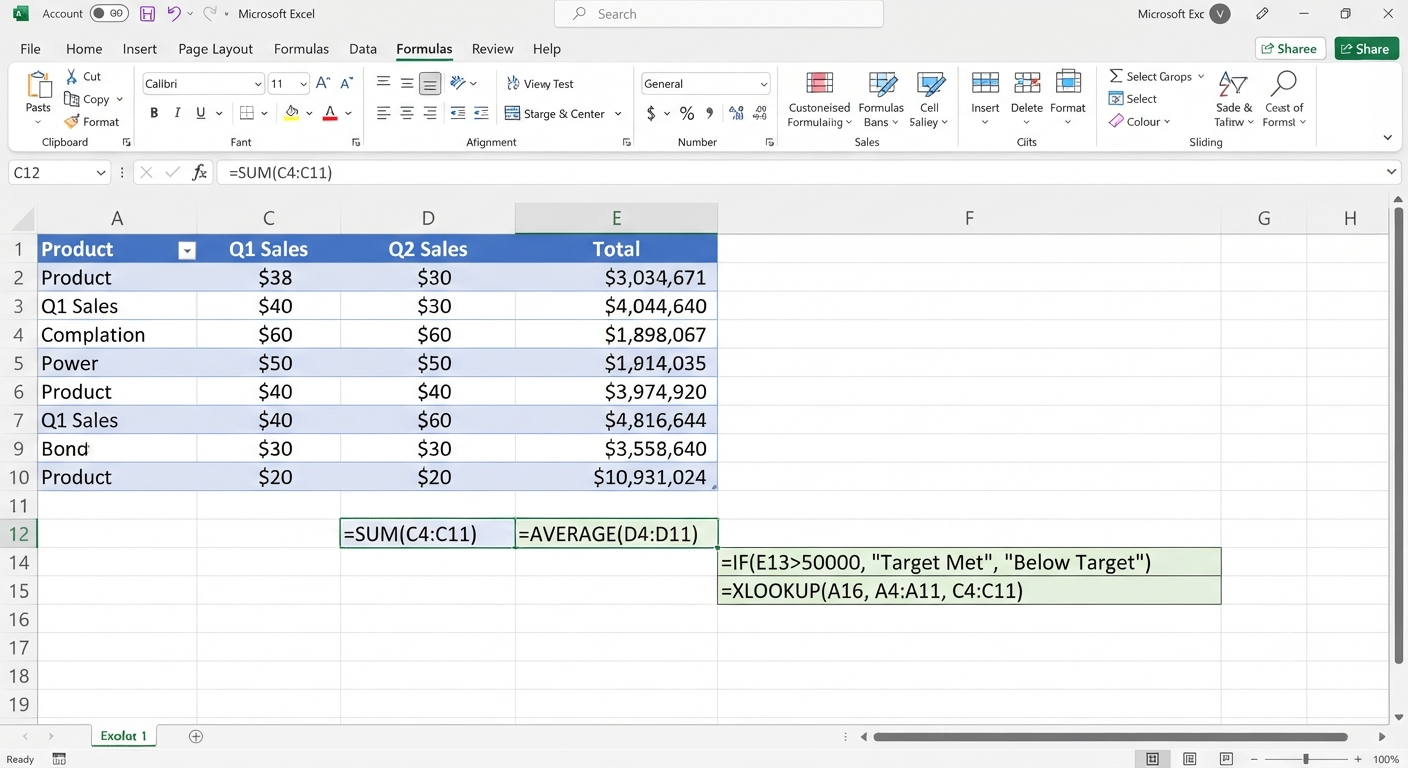
Master Essential Excel Formulas
Formulas are the foundation of Excel.
Every professional should understand commonly used functions such as:
SUM
Adds numbers quickly.
Example:
=SUM(B2:B20)AVERAGE
Calculates the average value.
=AVERAGE(C2:C15)IF
Performs logical tests.
=IF(D2>=70,"Pass","Fail")XLOOKUP
Searches for data efficiently across tables.
=XLOOKUP(A2,Products!A:A,Products!C:C)SUMIFS
Calculates totals based on multiple conditions.
=SUMIFS(C:C,A:A,"North",B:B,"Laptop")Mastering these functions significantly improves productivity.
Use Excel Tables
Excel Tables provide a structured way to manage datasets.
Advantages include:
- Automatic formatting
- Built-in filters
- Dynamic ranges
- Structured references
- Easier formula management
Tables also simplify data updates and reporting.
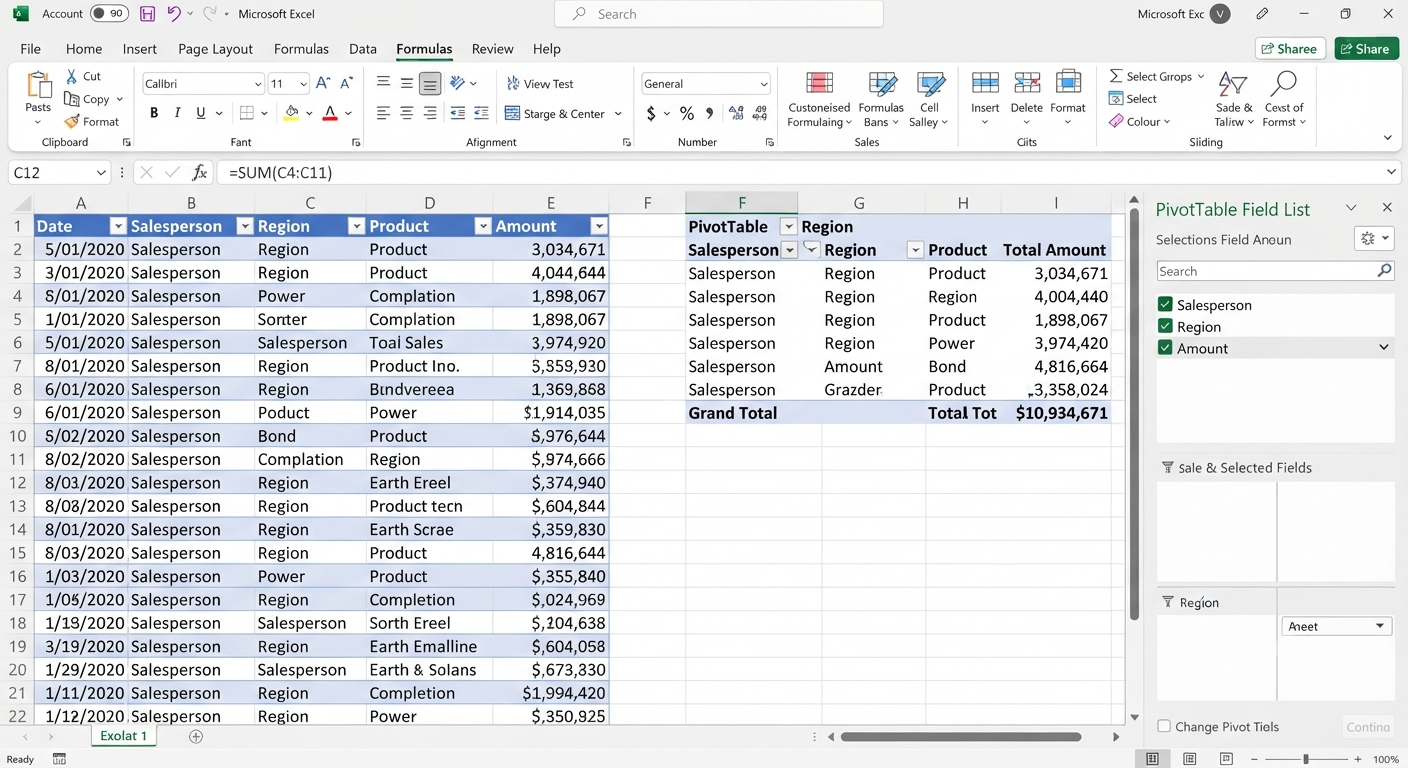
Analyze Data with PivotTables
PivotTables are among Excel’s most powerful analytical tools.
They allow users to:
- Summarize large datasets
- Group information
- Calculate totals
- Compare categories
- Create interactive reports
Instead of manually calculating summaries, PivotTables generate reports in seconds.
Image: Excel PivotTable summarizing sales performance.
Visualize Information with Charts
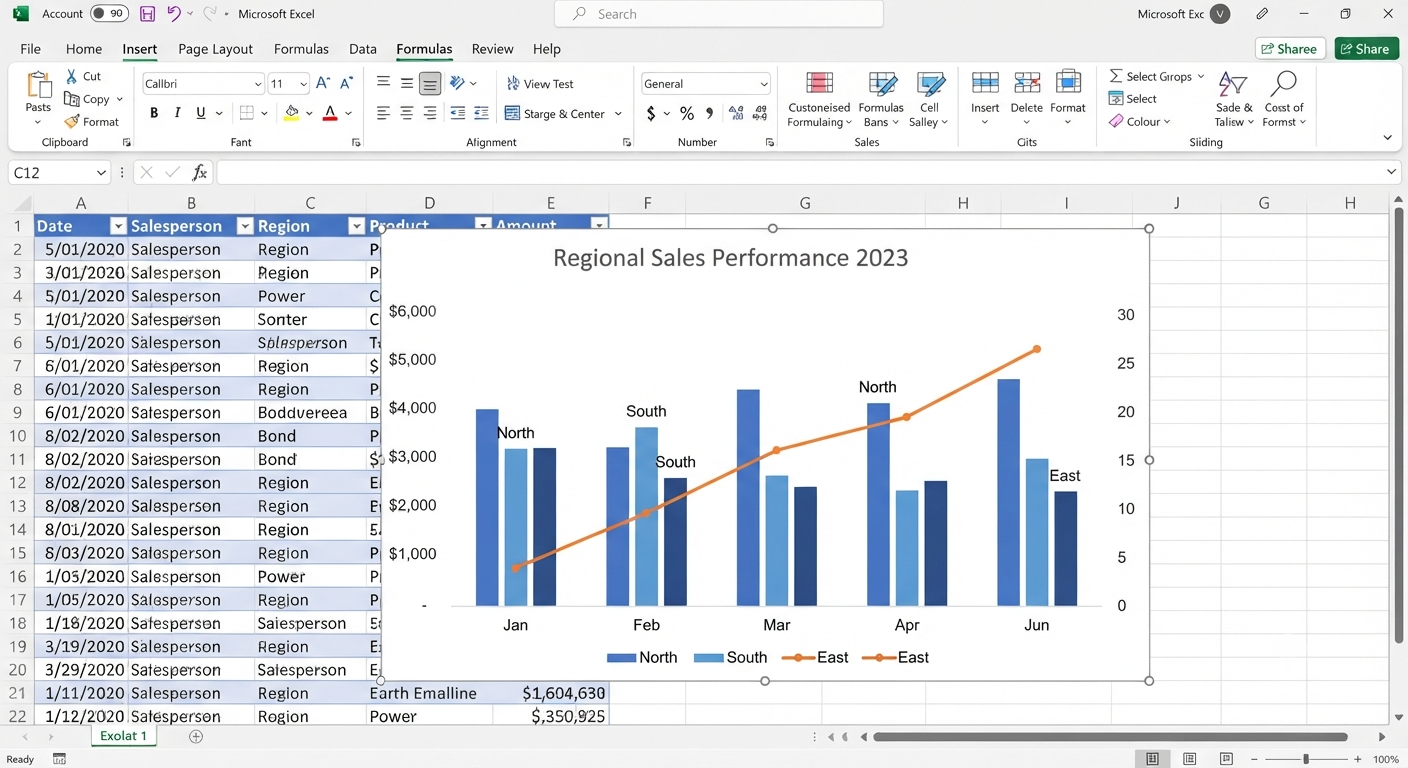
Charts make data easier to understand.
Excel supports numerous chart types, including:
- Column charts
- Bar charts
- Line charts
- Pie charts
- Area charts
- Scatter plots
- Combo charts
Selecting the right visualization helps communicate findings more effectively.
Apply Conditional Formatting
Conditional formatting automatically highlights important information.
Common uses include:
- Identifying duplicate values
- Highlighting top performers
- Flagging overdue tasks
- Displaying color scales
- Showing data bars
These visual cues make large datasets easier to interpret.
Use Data Validation
Data validation improves accuracy by restricting user input.
Examples include:
- Drop-down lists
- Date restrictions
- Number limits
- Custom validation formulas
This feature reduces data entry errors and maintains consistency.
Clean Data with Power Query
Power Query simplifies importing and transforming data.
Professionals use it to:
- Combine multiple files
- Remove duplicates
- Split columns
- Change data types
- Filter unnecessary records
Because Power Query records each transformation step, recurring tasks can be refreshed automatically whenever new data becomes available.
Build Professional Dashboards
Dashboards provide a centralized view of business performance.
A typical Excel dashboard may include:
- Revenue trends
- Key performance indicators (KPIs)
- Charts
- Slicers
- PivotTables
- Conditional formatting
Interactive dashboards help managers monitor business performance in real time.
Leverage Power Pivot
Power Pivot extends Excel’s analytical capabilities by allowing users to work with large datasets and build relationships between multiple tables.
Benefits include:
- Data modeling
- Advanced calculations
- DAX formulas
- Improved reporting
- Faster analysis
It is especially useful for financial analysts and business intelligence professionals.
Automate Tasks with Macros
Macros eliminate repetitive work by recording actions or executing VBA code.
Typical automation tasks include:
- Formatting reports
- Importing data
- Generating invoices
- Cleaning datasets
- Printing documents
Automation improves consistency and saves valuable time.
Protect Worksheets and Workbooks
Professionals often work with confidential information.
Excel provides several protection features:
- Worksheet protection
- Workbook protection
- Password encryption
- Cell locking
- Hidden formulas
These tools help safeguard sensitive business data.
Collaborate Using Microsoft 365
Modern versions of Excel support cloud-based collaboration.
Teams can:
- Edit workbooks simultaneously
- Leave comments
- View version history
- Share files through OneDrive or SharePoint
Real-time collaboration improves productivity for distributed teams.
Keyboard Shortcuts Every Professional Should Know
Using shortcuts speeds up everyday tasks.
Some useful examples include:
| Shortcut | Function |
|---|---|
| Ctrl + C | Copy |
| Ctrl + V | Paste |
| Ctrl + Z | Undo |
| Ctrl + Shift + L | Toggle filters |
| Ctrl + T | Create a table |
| F4 | Repeat previous action or toggle absolute references in formulas |
| Alt + = | AutoSum |
| Ctrl + Arrow Keys | Navigate large datasets |
Learning keyboard shortcuts can significantly reduce the time spent on repetitive actions.
Organize Workbooks Efficiently
Professional spreadsheets should be easy to maintain.
Best practices include:
- Use descriptive worksheet names.
- Separate raw data from calculations.
- Apply consistent formatting.
- Document complex formulas.
- Keep input cells clearly identified.
Well-organized workbooks are easier to understand and audit.
Integrate Excel with Other Microsoft Applications
Excel works seamlessly with other Microsoft products, including:
- Word
- Outlook
- PowerPoint
- Access
- Power BI
- Microsoft Teams
These integrations streamline workflows and improve data sharing across departments.
Common Mistakes to Avoid
Even experienced users make mistakes.
Avoid:
- Hardcoding values inside formulas
- Using merged cells excessively
- Ignoring data validation
- Creating unnecessarily complex formulas
- Forgetting to back up important files
Keeping spreadsheets simple and well documented reduces errors and simplifies future updates.
Tips for Improving Excel Performance
Large workbooks can become slow over time.
To optimize performance:
- Remove unnecessary formatting.
- Limit volatile functions where possible.
- Convert formulas to values when appropriate.
- Delete unused worksheets.
- Use Power Query for large imports.
- Save files in the modern XLSX format.
These practices help maintain responsive workbooks.
Frequently Asked Questions
Is Excel still relevant for professionals?
Yes. Excel remains one of the most widely used business applications for data analysis, reporting, budgeting, financial modeling, forecasting, and project management.
What is the most important Excel feature for professionals?
PivotTables are among the most valuable features because they allow users to summarize and analyze large datasets quickly. Combined with Power Query and charts, they provide a powerful reporting solution.
Should I learn VBA?
While VBA is not required for everyday Excel use, learning it can greatly improve productivity by automating repetitive tasks and creating customized workflows.
Can Excel handle large datasets?
Yes. Modern versions of Excel support over one million rows per worksheet. For very large datasets or advanced business intelligence scenarios, combining Excel with Power Query, Power Pivot, or Power BI offers even greater analytical capabilities.
How can I improve my Excel skills?
Practice regularly with real-world data, explore advanced features such as PivotTables and Power Query, learn useful keyboard shortcuts, and stay up to date with new Microsoft Excel features introduced through Microsoft 365.
Conclusion
Microsoft Excel continues to be an indispensable tool for professionals in virtually every industry. Its comprehensive set of features—including formulas, PivotTables, charts, Power Query, Power Pivot, dashboards, macros, and collaboration tools—makes it an ideal platform for managing data, performing complex analyses, and supporting informed business decisions.