


Mastering Standard Deviation in Excel: Methods and Examples
Standard deviation is one of the most important statistical measures used in data analysis. It helps determine how much a set of values varies from the average (mean). Whether you’re analyzing financial data, sales figures, test scores, scientific measurements, or business performance metrics, understanding standard deviation can provide valuable insights into the consistency and reliability of your data.
Microsoft Excel makes calculating standard deviation quick and straightforward with built-in statistical functions. Instead of performing complex calculations manually, users can apply simple formulas to analyze datasets of any size.
In this guide, you’ll learn what standard deviation is, why it matters, the different standard deviation functions available in Excel, and how to calculate standard deviation step by step.
What Is Standard Deviation?
Standard deviation is a statistical measurement that indicates how spread out data points are from the mean value.
What Standard Deviation Tells You
- A low standard deviation means values are close to the average.
- A high standard deviation means values are spread over a wider range.
- It helps measure variability and consistency within a dataset.
For example, if two classes have the same average test score but different standard deviations, the class with the lower standard deviation has scores that are more consistent.
Why Use Standard Deviation in Excel?
Excel is widely used for statistical analysis because it simplifies complex calculations.
Common Uses of Standard Deviation
- Financial risk analysis
- Sales performance evaluation
- Quality control processes
- Market research
- Scientific studies
- Academic data analysis
- Business forecasting
Using Excel allows users to calculate standard deviation instantly, even for large datasets.
Understanding Population vs. Sample Standard Deviation
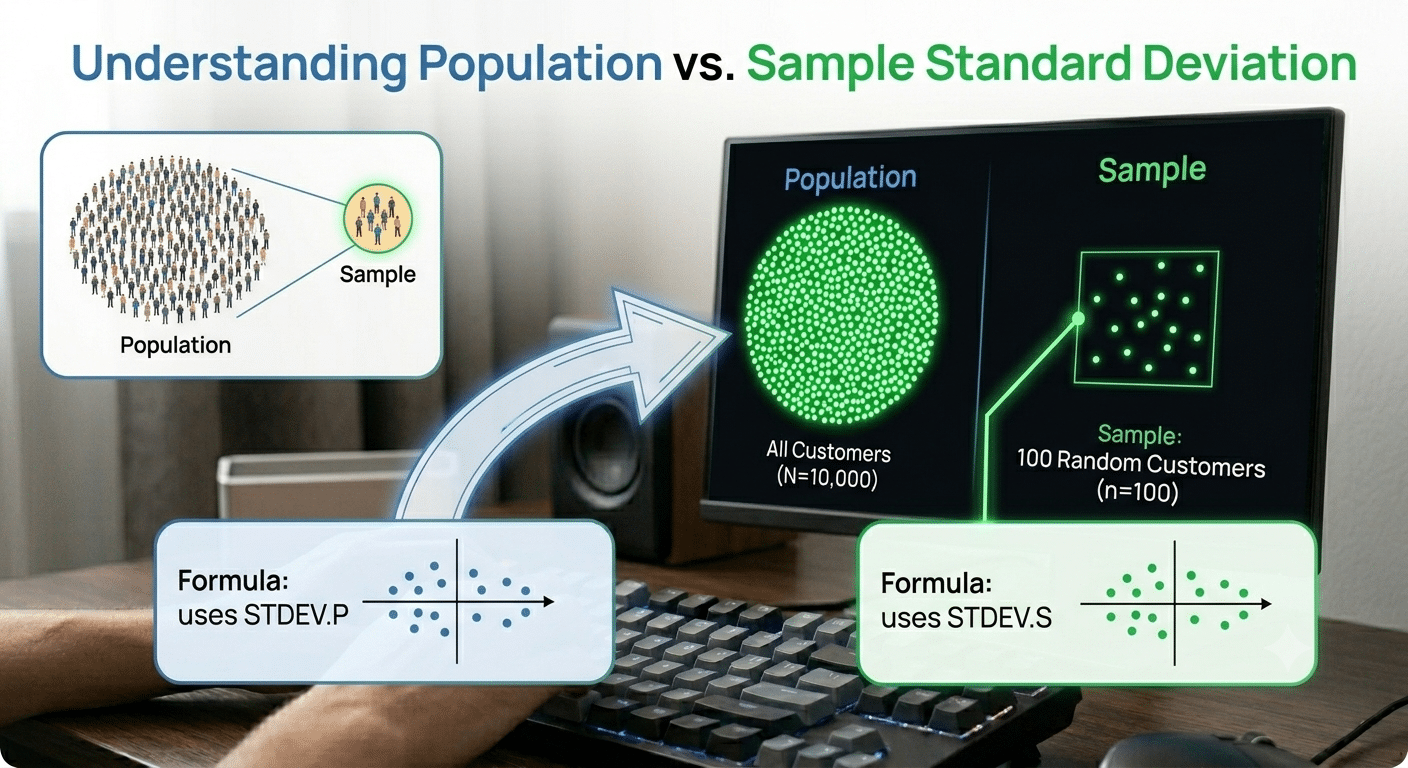
Before calculating standard deviation in Excel, it’s important to understand the difference between a population and a sample.
Population Standard Deviation
A population includes every member of the group being studied.
Example:
- All employees in a company
- Every product manufactured in a batch
Sample Standard Deviation
A sample represents only a portion of the population.
Example:
- 100 customers selected from 10,000 customers
- A sample of products chosen for inspection
Excel provides different functions depending on whether you’re working with a sample or a complete population.
Standard Deviation Functions in Excel
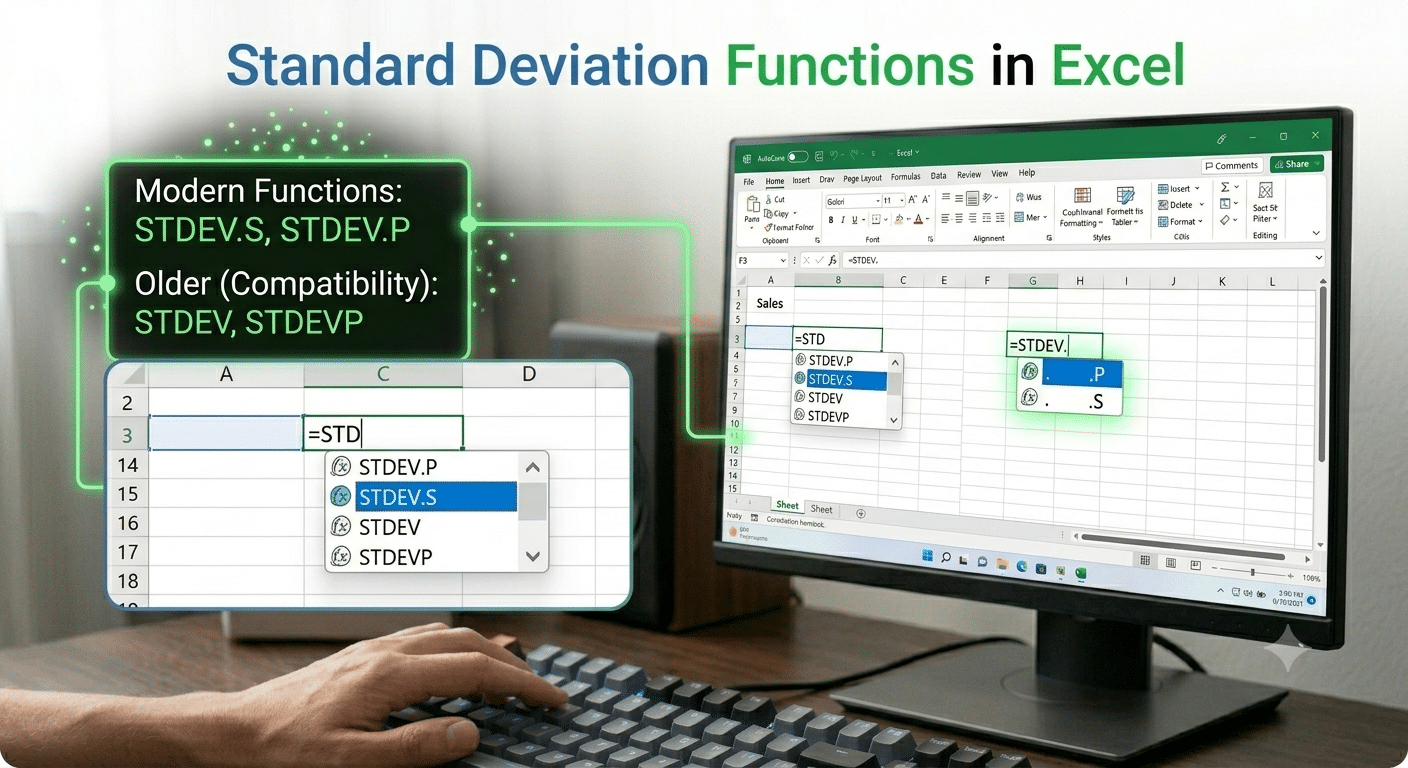
Modern versions of Excel include several standard deviation functions.
STDEV.S
Used for sample standard deviation.
=STDEV.S(number1, [number2], ...)STDEV.P
Used for population standard deviation.
=STDEV.P(number1, [number2], ...)Older Functions
Older Excel versions may include:
=STDEV()and
=STDEVP()These remain available for compatibility but are considered outdated.
Preparing Your Data
Before calculating standard deviation, organize your data properly.
Example Dataset
| Sales |
|---|
| 120 |
| 135 |
| 110 |
| 140 |
| 125 |
| 130 |
| 145 |
Place the values in a single column for easier analysis.
How to Calculate Sample Standard Deviation in Excel
Let’s calculate the standard deviation for a sample dataset.
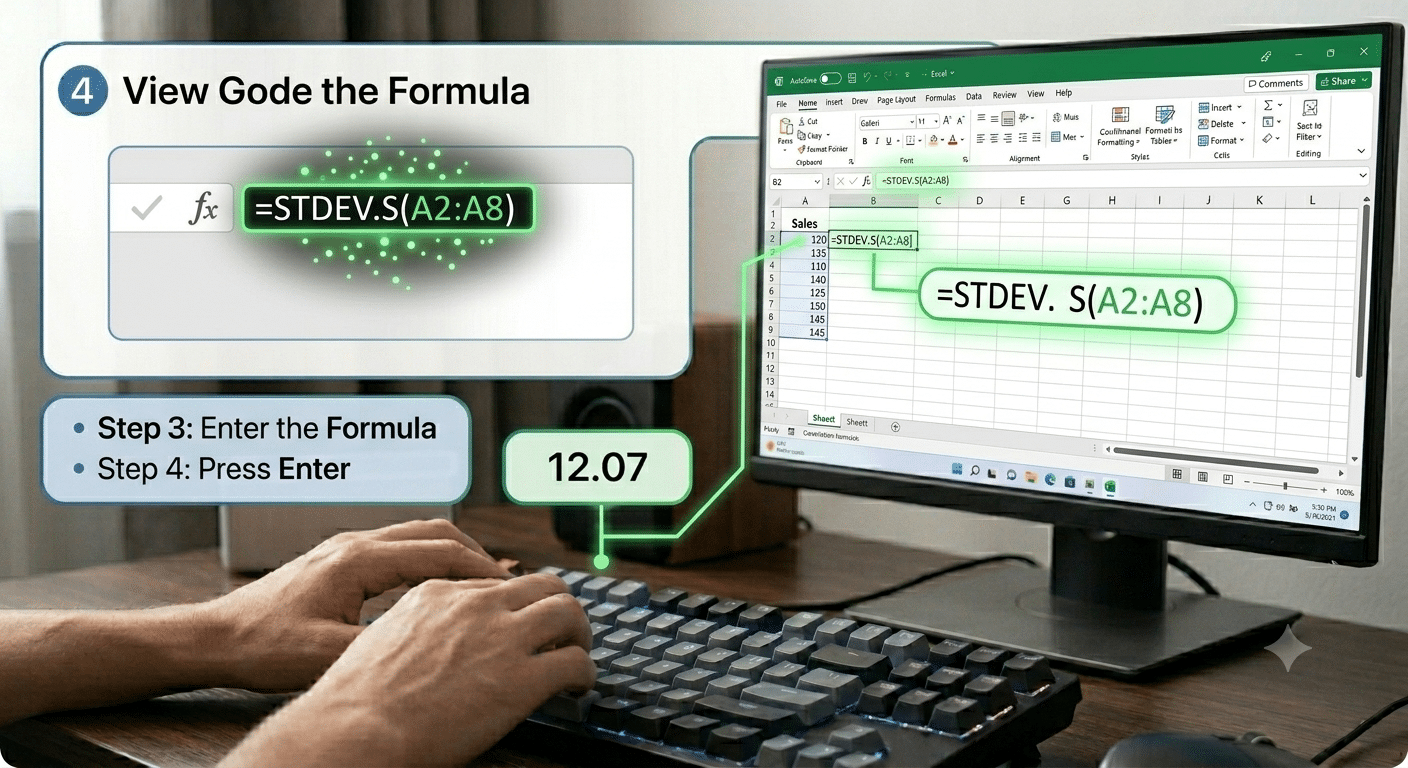
Step 1: Enter Your Data
Suppose the values are located in cells:
A2:A8Step 2: Select an Empty Cell
Choose a cell where you want the result displayed.
Example:
B2Step 3: Enter the Formula
Type:
=STDEV.S(A2:A8)Step 4: Press Enter
Excel immediately calculates the sample standard deviation.
The resulting number indicates how much the values vary from the average.
How to Calculate Population Standard Deviation
If your dataset represents the entire population, use STDEV.P.
Formula
=STDEV.P(A2:A8)When to Use It
Use STDEV.P when every member of the population is included in the dataset.
Understanding the Results
The standard deviation value itself has meaning only when compared to the data.
Example
Suppose:
- Mean = 130
- Standard deviation = 5
This indicates that most values are relatively close to 130.
Now suppose:
- Mean = 130
- Standard deviation = 35
This suggests much greater variability among the values.
Calculating Standard Deviation Using Excel Functions and Cell References
Excel allows flexible formula creation.
Example
Instead of manually entering values:
=STDEV.S(A2:A20)Excel automatically updates calculations if data changes within the specified range.
Calculating Standard Deviation for Multiple Columns
Suppose sales data exists for different regions.
| East | West |
|---|---|
| 100 | 90 |
| 110 | 120 |
| 130 | 140 |
| 125 | 150 |
East Region
=STDEV.S(A2:A5)West Region
=STDEV.S(B2:B5)This allows comparison between datasets.
Using Standard Deviation with Dynamic Data
When data is frequently updated, Excel Tables can simplify calculations.
Create a Table
- Select your dataset.
- Press:
Ctrl + T- Confirm table creation.
Use Structured References
=STDEV.S(Table1[Sales])The formula automatically expands when new data is added.
Combining Standard Deviation with Average Calculations
Often, standard deviation is analyzed alongside the mean.
Calculate the Average
=AVERAGE(A2:A20)Calculate Standard Deviation
=STDEV.S(A2:A20)Together, these values provide a clearer picture of data distribution.
Using Standard Deviation in Financial Analysis
Investors often use standard deviation to measure risk.
Higher Standard Deviation
- Greater volatility
- Higher uncertainty
Lower Standard Deviation
- More stable performance
- Lower risk
Excel is commonly used to evaluate investment returns using standard deviation calculations.
Using Standard Deviation in Quality Control
Manufacturers use standard deviation to monitor production consistency.
Benefits
- Identify process variation
- Detect quality issues
- Improve product reliability
Smaller standard deviations generally indicate better process control.
Visualizing Standard Deviation with Charts
Charts help illustrate data variation.
Useful Chart Types
- Histograms
- Scatter plots
- Line charts
- Error bar charts
Combining visualizations with standard deviation calculations enhances data analysis.
Common Errors When Calculating Standard Deviation
Several issues may affect your results.
Using the Wrong Function
Choose:
- STDEV.S for samples
- STDEV.P for populations
Using the wrong function may produce inaccurate results.
Including Non-Numeric Data
Standard deviation functions ignore text values but may lead to incomplete analysis.
Incorrect Range Selection
Verify that the selected range includes all intended data points.
Tips for Accurate Standard Deviation Calculations
Keep Data Clean
Remove:
- Duplicate entries
- Invalid values
- Formatting inconsistencies
Verify Data Types
Ensure numeric values are stored as numbers, not text.
Use Consistent Units
All data should be measured using the same scale and units.
Standard Deviation vs. Variance
Variance and standard deviation are closely related.
Variance
Measures average squared deviation from the mean.
Standard Deviation
Represents the square root of variance.
Because standard deviation uses the same units as the original data, it is generally easier to interpret.
Advantages of Using Excel for Statistical Analysis
Excel remains one of the most popular tools for data analysis.
Benefits
- Easy-to-use formulas
- Fast calculations
- Automatic updates
- Built-in statistical functions
- Data visualization capabilities
- Compatibility with large datasets
These features make Excel suitable for both beginners and advanced analysts.
When Should You Use Standard Deviation?
Standard deviation is useful whenever you need to understand data variability.
Examples
- Student exam scores
- Monthly sales reports
- Investment returns
- Manufacturing measurements
- Customer satisfaction ratings
- Website traffic analysis
It provides a simple way to assess consistency and identify unusual variations.
Final Thoughts
Standard deviation is one of the most valuable statistical tools available in Microsoft Excel. It helps measure how much data varies from the average, making it easier to identify trends, evaluate consistency, and make informed decisions.
By using Excel’s built-in functions such as STDEV.S and STDEV.P, you can calculate standard deviation quickly and accurately without performing complex manual calculations. Whether you’re analyzing business data, financial reports, research findings, or operational performance, understanding standard deviation can significantly improve your ability to interpret and evaluate data.