


Master Advanced Excel: Key Functions and Core Techniques
Microsoft Excel is much more than a simple spreadsheet application. It is a comprehensive platform for data analysis, financial modeling, reporting, automation, and business intelligence. While basic Excel skills such as entering data and using simple formulas are valuable, mastering advanced Excel features can significantly improve productivity and open the door to more sophisticated data analysis.
Whether you are a business analyst, accountant, project manager, researcher, or student, understanding Excel’s advanced capabilities will help you work smarter, make data-driven decisions, and automate repetitive tasks. This guide explores the key areas and functions every advanced Excel user should know.
Why Learn Advanced Excel?
Advanced Excel skills enable users to handle larger datasets, create dynamic reports, automate workflows, and uncover valuable insights from data.
Some key benefits include:
- Increased productivity
- Improved data accuracy
- Faster report generation
- Better decision-making
- Enhanced career opportunities
- Greater efficiency when working with large datasets
Many employers consider advanced Excel knowledge an essential skill for professional roles in finance, operations, marketing, engineering, and data analysis.
Master Advanced Excel Formulas
Formulas are at the core of Excel’s analytical capabilities. Learning advanced functions allows you to solve complex problems with minimal effort.
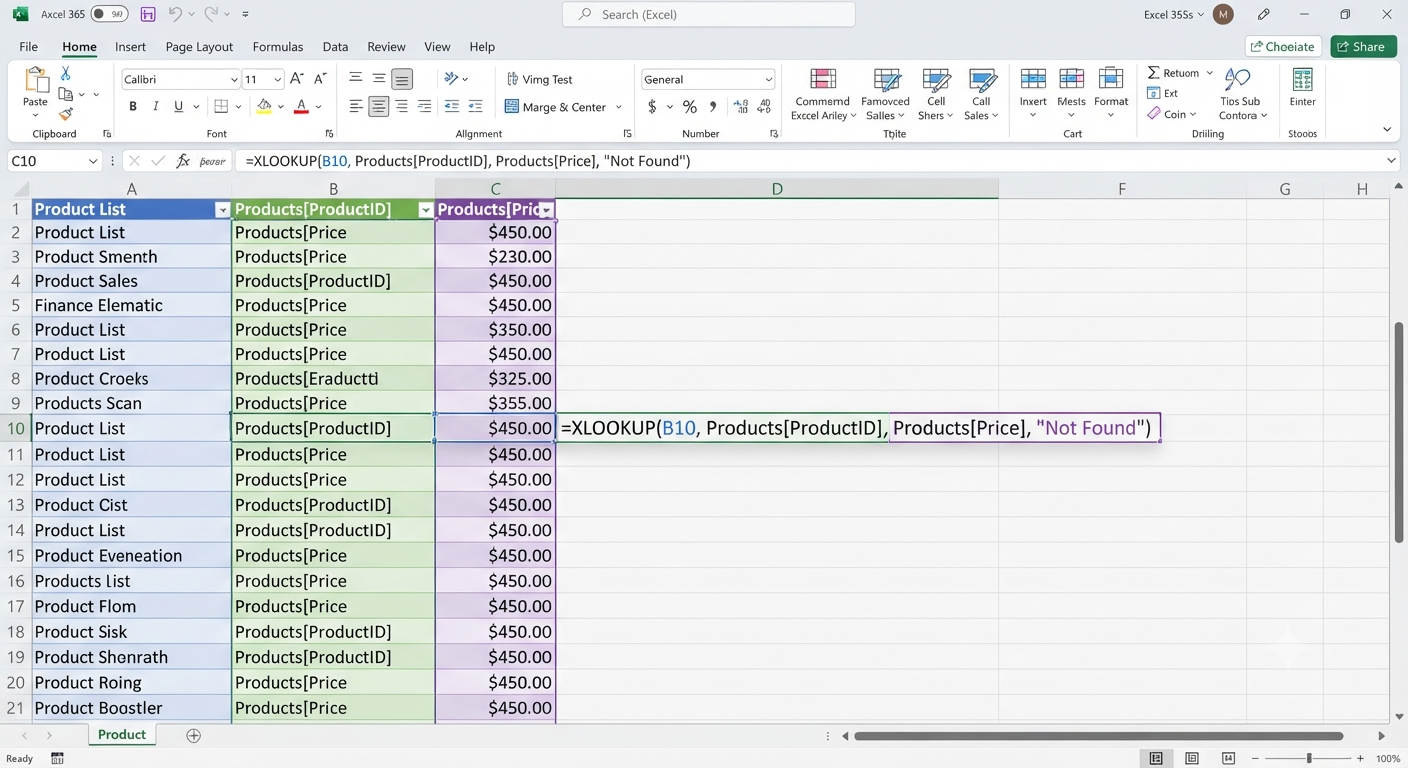
XLOOKUP
XLOOKUP is one of Excel’s most powerful lookup functions and serves as a modern replacement for VLOOKUP and HLOOKUP.
Example:
=XLOOKUP(A2,Products[ID],Products[Price])Advantages include:
- Searches both vertically and horizontally
- Supports exact matching by default
- Returns custom values if no match is found
- Works without sorting data
INDEX and MATCH
Although XLOOKUP is preferred in newer versions, INDEX and MATCH remain valuable for compatibility and flexibility.
Example:
=INDEX(C2:C100,MATCH(F2,A2:A100,0))This combination allows dynamic lookups across complex datasets.
SUMIFS and COUNTIFS
These functions calculate results based on multiple conditions.
Example:
=SUMIFS(C:C,A:A,"North",B:B,"Laptop")They are commonly used in financial reports and sales analysis.
IF, IFS, and Nested Logic
Logical functions help automate decision-making.
Example:
=IFS(A2>=90,"Excellent",A2>=75,"Good",A2>=60,"Average",TRUE,"Needs Improvement")These functions simplify complex conditional calculations.
Dynamic Array Functions
Dynamic arrays automatically return multiple values without copying formulas.
Useful functions include:
- FILTER
- SORT
- SORTBY
- UNIQUE
- SEQUENCE
- RANDARRAY
FILTER Function
Example:
=FILTER(A2:D100,D2:D100="Completed")The function automatically returns matching records.
Work Efficiently with Excel Tables
Excel Tables provide structured data management.
Benefits include:
- Automatic formatting
- Dynamic formulas
- Built-in filters
- Easier referencing
- Automatic expansion
Tables simplify workbook maintenance and improve formula readability.
Master PivotTables
PivotTables remain one of Excel’s most powerful reporting tools.
They enable users to:
- Summarize data
- Compare categories
- Group information
- Analyze trends
- Calculate totals
- Create interactive reports
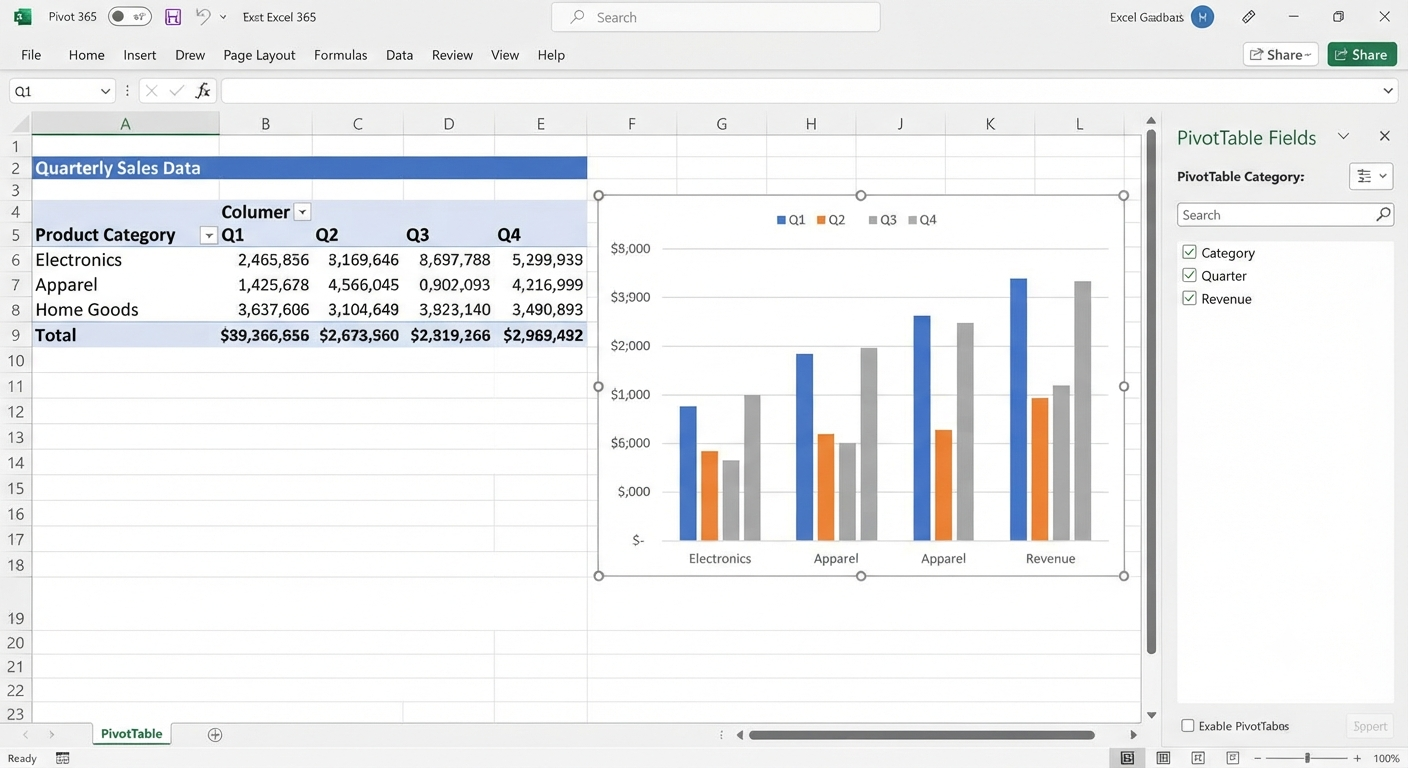
Rather than writing complicated formulas, PivotTables summarize thousands of records within seconds.
Image: Excel PivotTable displaying quarterly sales data.
Create Interactive Dashboards
Professional dashboards combine multiple Excel features into a single reporting interface.
Typical dashboard components include:
- PivotTables
- Charts
- Slicers
- Timelines
- Conditional formatting
- KPIs
Interactive dashboards provide executives with real-time business insights.
Use Power Query for Data Preparation
Power Query simplifies importing and transforming data from multiple sources.
Tasks include:
- Importing CSV files
- Connecting to databases
- Combining worksheets
- Removing duplicates
- Cleaning inconsistent values
- Splitting and merging columns
Power Query records each transformation step, allowing reports to be refreshed with updated data automatically.
Analyze Large Datasets with Power Pivot
Power Pivot extends Excel’s capabilities beyond traditional worksheets.
Features include:
- Data modeling
- Relationships between tables
- DAX calculations
- Large dataset analysis
- Business intelligence reporting
Power Pivot is particularly useful for financial analysts and reporting professionals.
Learn Data Analysis Tools
Excel includes several built-in analysis tools.
Popular examples include:
What-If Analysis
Useful tools include:
- Goal Seek
- Scenario Manager
- Data Tables
These features help evaluate different business scenarios.
Solver
Solver finds optimal solutions for complex mathematical and business problems.
Applications include:
- Budget optimization
- Resource allocation
- Production planning
- Investment analysis
Automate Tasks with Macros
Macros eliminate repetitive manual work.
Common automation examples include:
- Formatting reports
- Importing files
- Generating invoices
- Creating summaries
- Printing documents
Recorded macros require little programming knowledge.
Advanced users can customize automation using Visual Basic for Applications (VBA).
Understand VBA Basics
VBA allows users to build customized Excel solutions.
Examples include:
- Automated workflows
- User forms
- Custom functions
- Advanced report generation
- Database interaction
Although learning VBA takes time, it significantly expands Excel’s capabilities.
Visualize Data with Advanced Charts
Choosing the right chart improves communication.
Useful chart types include:
- Waterfall charts
- Combo charts
- Scatter plots
- Bubble charts
- Treemaps
- Sunburst charts
- Histograms
Professional visualizations make reports easier to understand.
Apply Conditional Formatting
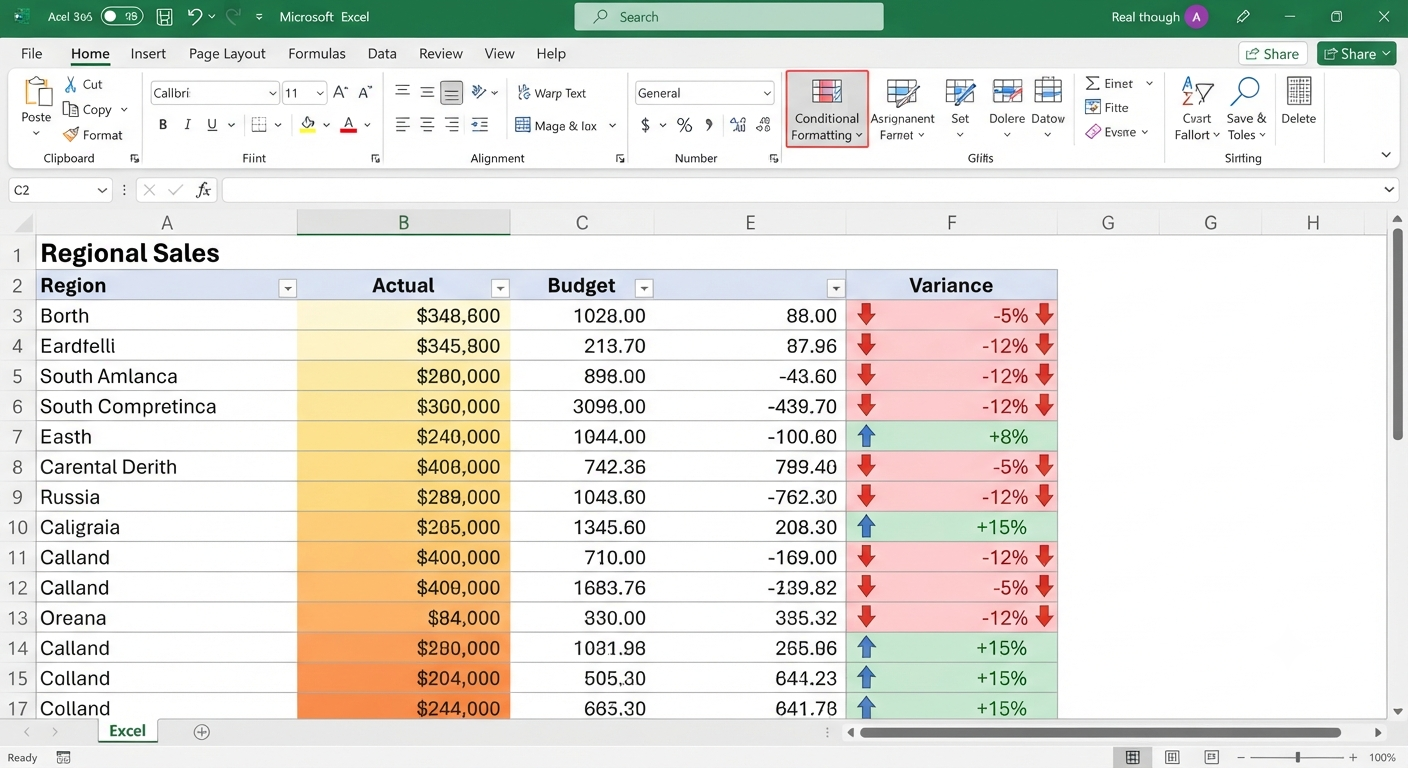
Conditional formatting automatically highlights important information.
Examples include:
- Duplicate values
- Top-performing products
- Negative profits
- Deadline reminders
- Color scales
Visual indicators help users identify trends immediately.
Protect Workbooks
Professionals often work with confidential information.
Excel provides protection through:
- Worksheet passwords
- Workbook encryption
- Locked cells
- Hidden formulas
- Permission controls
These features help prevent accidental changes and unauthorized access.
Use Data Validation
Data validation improves spreadsheet accuracy.
Common applications include:
- Drop-down lists
- Date restrictions
- Number limits
- Custom validation rules
This feature reduces input errors in shared workbooks.
Master Keyboard Shortcuts
Advanced users rely on keyboard shortcuts to work efficiently.
Helpful shortcuts include:
| Shortcut | Action |
|---|---|
| Ctrl + T | Create a table |
| Ctrl + Shift + L | Toggle filters |
| Alt + = | AutoSum |
| Ctrl + Arrow Keys | Navigate data |
| F4 | Repeat action or toggle absolute references |
| Ctrl + Shift + Arrow Keys | Select data ranges |
| Ctrl + 1 | Open Format Cells dialog |
Using shortcuts consistently can save considerable time.
Collaborate Using Microsoft 365
Modern Excel supports cloud collaboration.
Teams can:
- Edit workbooks simultaneously
- Share files through OneDrive
- Track version history
- Add comments
- Assign tasks using mentions
Real-time collaboration is particularly useful for distributed teams.
Best Practices for Advanced Excel Users
To build reliable workbooks:
- Keep raw data separate from reports.
- Avoid hardcoding values in formulas.
- Use descriptive worksheet names.
- Document complex calculations.
- Test formulas thoroughly.
- Maintain consistent formatting.
- Back up important files regularly.
Following these practices improves maintainability and reduces errors.
Common Mistakes to Avoid
Even experienced users sometimes encounter issues.
Avoid:
- Overusing merged cells
- Creating excessively long formulas
- Ignoring data validation
- Leaving unused named ranges
- Forgetting to refresh Power Query data
Simple, organized workbooks are easier to troubleshoot and update.
Frequently Asked Questions
What skills define an advanced Excel user?
Advanced users typically understand complex formulas, PivotTables, Power Query, Power Pivot, dashboards, macros, VBA basics, and advanced charting techniques.
Should I learn VBA or Power Query first?
For most users, learning Power Query first is recommended because it simplifies data preparation without requiring programming knowledge. VBA becomes valuable when you need more advanced automation and customization.
Is XLOOKUP better than VLOOKUP?
Yes. XLOOKUP is generally more flexible and easier to use. It supports searches in any direction, provides better error handling, and eliminates many limitations associated with VLOOKUP.
Can Excel handle business intelligence tasks?
Yes. Combined with Power Query, Power Pivot, PivotTables, and dashboards, Excel can perform many business intelligence functions. For enterprise-scale analytics, it also integrates seamlessly with Microsoft Power BI.
How long does it take to master advanced Excel?
The learning curve depends on your experience and the features you study. With consistent practice using real-world datasets, many users can become proficient in advanced Excel within a few months.
Conclusion
Mastering advanced Excel is one of the most valuable investments you can make for your professional development. By learning powerful formulas, PivotTables, Power Query, Power Pivot, dashboards, macros, VBA, and advanced data visualization techniques, you can transform Excel into a robust platform for analysis, automation, and decision-making.