


Excel Z-Score Explained: Formula, Definition, and Examples
The Z-score, also known as the standard score, is one of the most widely used statistical measures in data analysis. It helps determine how far a data point is from the mean of a dataset, expressed in terms of standard deviations. Whether you’re analyzing exam scores, financial performance, scientific data, or quality control metrics, understanding Z-scores can help you identify trends, compare values, and detect outliers.
Microsoft Excel makes it easy to calculate Z-scores using built-in formulas and functions, eliminating the need for complex statistical software. This guide explains what a Z-score is, why it is important, how to calculate it in Excel, and provides practical examples to help you master this essential statistical concept.
What Is a Z-Score?
A Z-score measures the distance between a data value and the mean of a dataset in units of standard deviation.
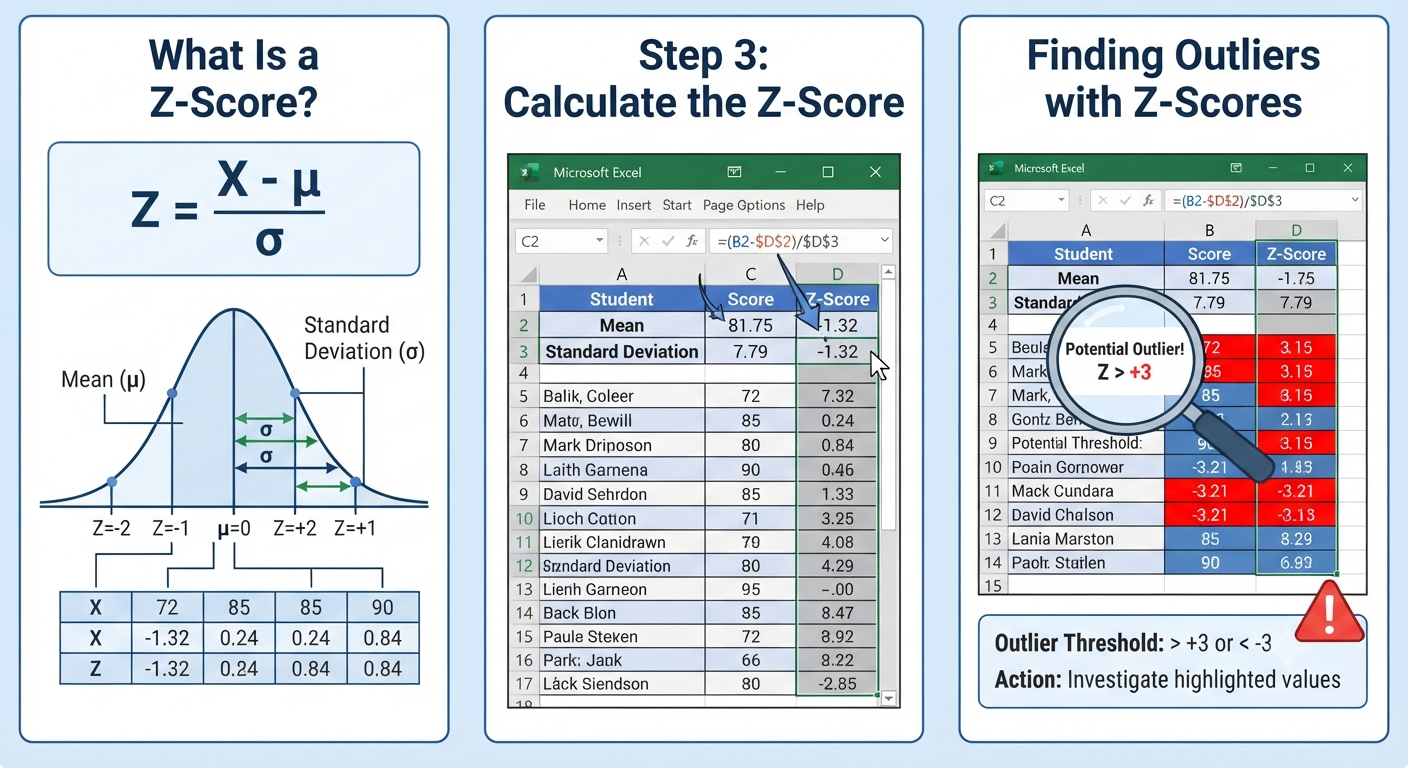
The formula is:
Z = (X - μ) / σWhere:
- X = Individual data value
- μ (mu) = Mean of the dataset
- σ (sigma) = Standard deviation
A positive Z-score means the value is above the mean, while a negative Z-score indicates the value is below the mean.
Why Is the Z-Score Important?
Z-scores are useful because they standardize data, making it easier to compare values from different datasets.
Benefits include:
- Identifying outliers
- Comparing values across datasets
- Understanding data distribution
- Supporting statistical analysis
- Improving decision-making
- Performing hypothesis testing
Many fields, including finance, healthcare, engineering, and education, rely on Z-scores for data interpretation.
Understanding Positive and Negative Z-Scores
A Z-score indicates how far a value is from the average.
For example:
| Z-Score | Interpretation |
|---|---|
| 0 | Exactly at the mean |
| +1 | One standard deviation above the mean |
| +2 | Two standard deviations above the mean |
| -1 | One standard deviation below the mean |
| -2 | Two standard deviations below the mean |
The larger the absolute value of the Z-score, the farther the observation is from the average.
Preparing Your Data in Excel
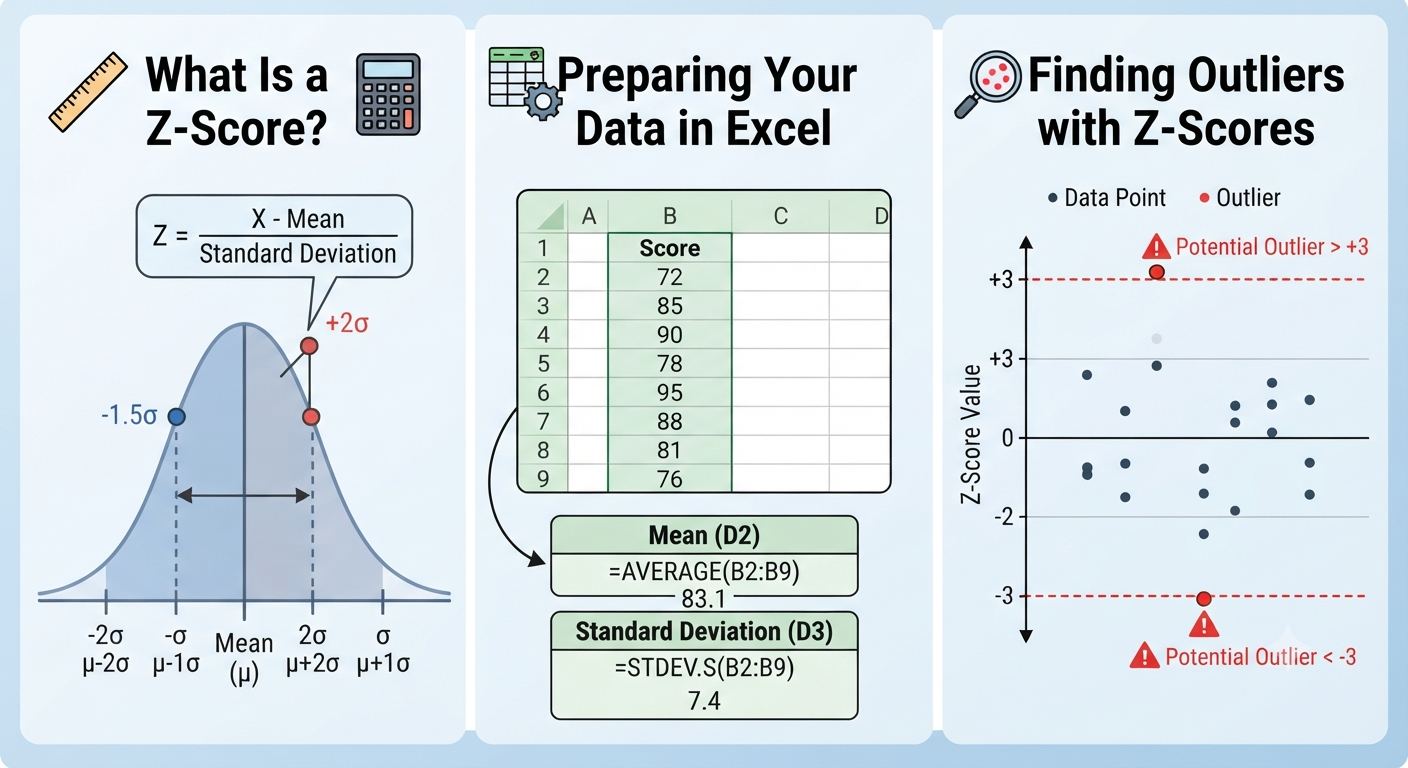
Suppose you have the following exam scores.
| Student | Score |
|---|---|
| Alex | 72 |
| Emma | 85 |
| Liam | 90 |
| Sophia | 78 |
| Noah | 95 |
| Olivia | 88 |
| Mason | 81 |
| Ava | 76 |
Place the scores in cells B2:B9.
Step 1: Calculate the Mean
To calculate the average score:
=AVERAGE(B2:B9)Excel returns the arithmetic mean of the dataset.
Step 2: Calculate the Standard Deviation
If your data represents a sample, use:
=STDEV.S(B2:B9)If your data represents the entire population, use:
=STDEV.P(B2:B9)Choosing the correct function depends on whether your dataset is a sample or a complete population.
Step 3: Calculate the Z-Score
Suppose:
- Mean is stored in D2
- Standard deviation is stored in D3
In cell C2, enter:
=(B2-$D$2)/$D$3Then drag the formula downward to calculate Z-scores for every value.
Your worksheet may look like this:
| Student | Score | Z-Score |
|---|---|---|
| Alex | 72 | -1.32 |
| Emma | 85 | 0.24 |
| Liam | 90 | 0.84 |
| Sophia | 78 | -0.60 |
| Noah | 95 | 1.44 |
| Olivia | 88 | 0.60 |
| Mason | 81 | -0.24 |
| Ava | 76 | -0.84 |
These values are illustrative; your exact results depend on the calculated mean and standard deviation.
Image: Excel worksheet showing Z-score calculations using formulas.
Using the STANDARDIZE Function
Excel includes a built-in function specifically designed for Z-score calculations.
Syntax:
=STANDARDIZE(x, mean, standard_dev)Example:
=STANDARDIZE(B2,$D$2,$D$3)This function returns the same result as the manual formula but is often easier to read.
Interpreting Z-Scores
Understanding the results is just as important as calculating them.
Z-Score = 0
The value equals the mean.
Positive Z-Score
The observation is above average.
Example:
1.75This means the value is 1.75 standard deviations above the mean.
Negative Z-Score
The value is below average.
Example:
-1.20This indicates the observation is 1.20 standard deviations below the mean.
Finding Outliers with Z-Scores
One common use of Z-scores is detecting unusual values.
A common guideline is:
- Values with a Z-score greater than +3 or less than −3 may be considered potential outliers.
However, the appropriate threshold depends on the context and the characteristics of the data.
Using Conditional Formatting
Highlight high or low Z-scores automatically.
To do this:
- Select the Z-score column.
- Open Home > Conditional Formatting.
- Choose Highlight Cell Rules.
- Apply formatting for values greater than or less than your chosen threshold.
This makes unusual observations easier to identify.
Practical Applications of Z-Scores
Z-scores are used across many industries.
Education
Teachers use Z-scores to compare student performance across different exams.
Finance
Financial analysts evaluate stock performance and identify unusual market movements.
Healthcare
Researchers compare medical measurements with population averages.
Quality Control
Manufacturers identify products that fall outside acceptable quality limits.
Scientific Research
Scientists standardize measurements collected from different experiments.
Advantages of Using Z-Scores
Some major benefits include:
- Easy comparison of values
- Standardized measurement
- Supports statistical testing
- Helps identify outliers
- Useful for normally distributed data
- Simplifies data interpretation
These advantages make Z-scores one of the most frequently used statistical tools.
Limitations of Z-Scores
Although useful, Z-scores have limitations.
Keep in mind:
- They assume meaningful calculations of the mean and standard deviation.
- Interpretation is most straightforward when data is approximately normally distributed.
- Extreme outliers can influence the mean and standard deviation.
- Results depend on accurate input data.
Understanding these limitations leads to better statistical analysis.
Common Errors When Calculating Z-Scores
Beginners often make these mistakes:
- Using the wrong standard deviation function
- Forgetting absolute cell references
- Incorrectly entering formulas
- Mixing population and sample statistics
- Misinterpreting positive and negative values
Double-checking formulas helps prevent calculation errors.
Tips for Working with Z-Scores in Excel
For more efficient analysis:
- Label your data clearly.
- Store the mean and standard deviation in separate cells.
- Use absolute references when copying formulas.
- Verify your calculations with Excel’s STANDARDIZE function.
- Apply conditional formatting to highlight unusual values.
- Keep your source data organized in tables for easier analysis.
These practices improve accuracy and make your worksheets easier to maintain.
Frequently Asked Questions
What does a Z-score of 2 mean?
A Z-score of 2 means the value is two standard deviations above the mean. In a normally distributed dataset, this indicates the observation is relatively high compared to the average.
Can Excel calculate Z-scores automatically?
Yes. You can calculate Z-scores either by using the manual formula:
=(Value-Mean)/StandardDeviationor by using Excel’s built-in STANDARDIZE function.
What is the difference between STDEV.S and STDEV.P?
STDEV.S calculates the standard deviation for a sample, while STDEV.P is used when the dataset represents the entire population. Selecting the appropriate function depends on the nature of your data.
What is considered an outlier based on a Z-score?
A commonly used guideline is that observations with Z-scores greater than +3 or less than −3 may be considered potential outliers. However, the threshold should be evaluated in the context of the specific dataset and analysis.
Is the STANDARDIZE function better than using the formula manually?
Both methods produce the same result when the inputs are correct. The STANDARDIZE function can improve readability, while the manual formula provides greater transparency and flexibility for learning and customization.
Conclusion
The Z-score is a powerful statistical measure that helps you understand how individual values relate to the average of a dataset. By expressing observations in terms of standard deviations, Z-scores make it easier to compare data, detect outliers, and perform meaningful statistical analyses.